Home / Funnels
a ground-up redesign of Funnels.
I was interim lead UX designer at GameAnalytics, one of the most widely used analytics tools for mobile game developers, from solo studios to publishers with billions of downloads. Power users had abandoned our funnels and rebuilt them in Excel. I was product lead and sole designer of the rebuild, working with our backend team and focusing heavily on product discovery with customers.
- Problem
- Power users had abandoned our funnels and rebuilt them in Excel.
- Approach
- Queried production data, interviewed users and studied a studio's own Excel report.
- Outcome
- Faster, more actionable reports. Won back customers and converted more. Five years later, the feature still works much as I designed it.
The problem
Funnels were among the platform's most used features, and its most sophisticated users were abandoning them. One studio had given up on the UI entirely: they exported raw funnel data and rebuilt the visualization themselves in Excel.
As part of a total platform redesign, I led the funnels rebuild with a mandate to ship a beta for live testing with real studios.
My approach
I started with production data, used it to ask better questions in the interviews, and finished with market research.
Production data
I exported the 1,000 most recent funnels and queried them with Google Scripts. Three findings stood out:
- 84 percent of all funnel events were progression events
- Average funnel length was 18.5 steps, median 13.5
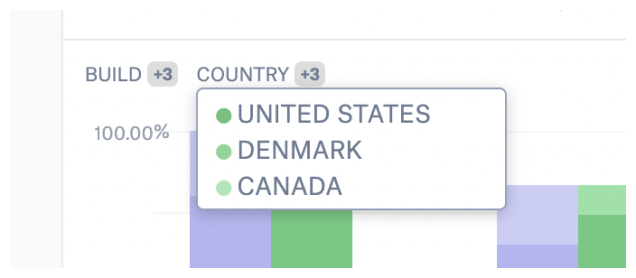
- 34 percent of funnels used filters, with build and country by far the most common
User interviews
Using customer support data, I identified developers, studios, and publishers who had recently asked about funnels and scheduled calls where they screen-shared their process. The production data let me ask precise questions. In the calls I learned:
- Funnels needed at least three iterations per game, across many games running simultaneously
- Processing could exceed 15 minutes, breaking flow and forcing context switches
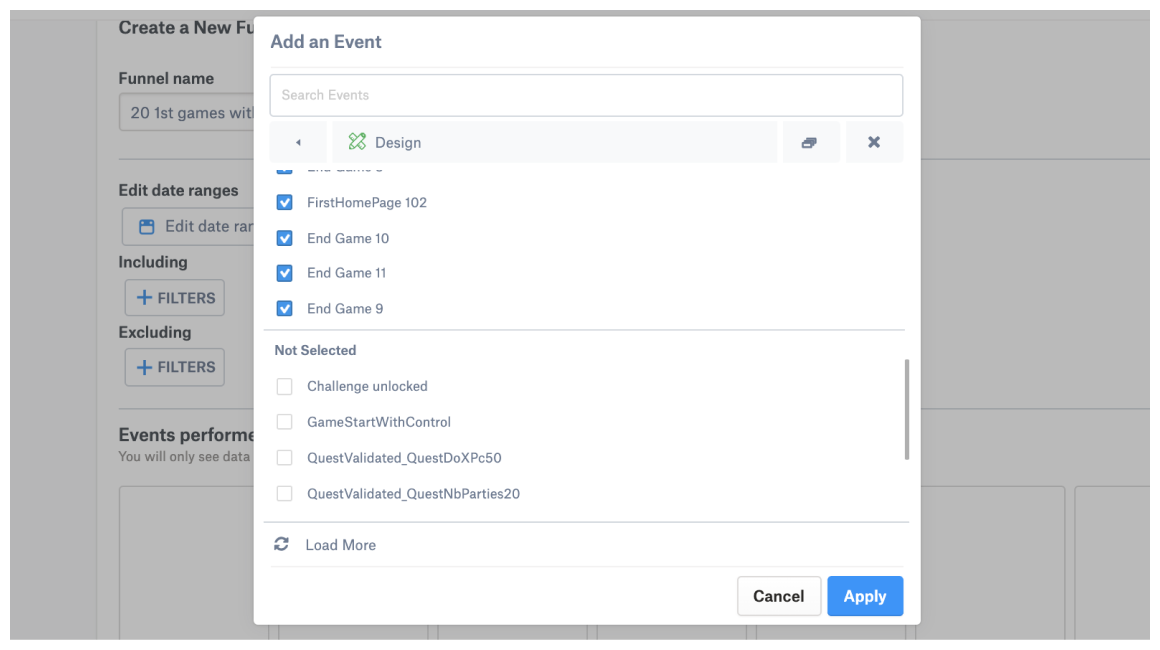
- The creation form did not match the SDK event structure
- Logical operators were invisible, so users could not tell what their funnel computed
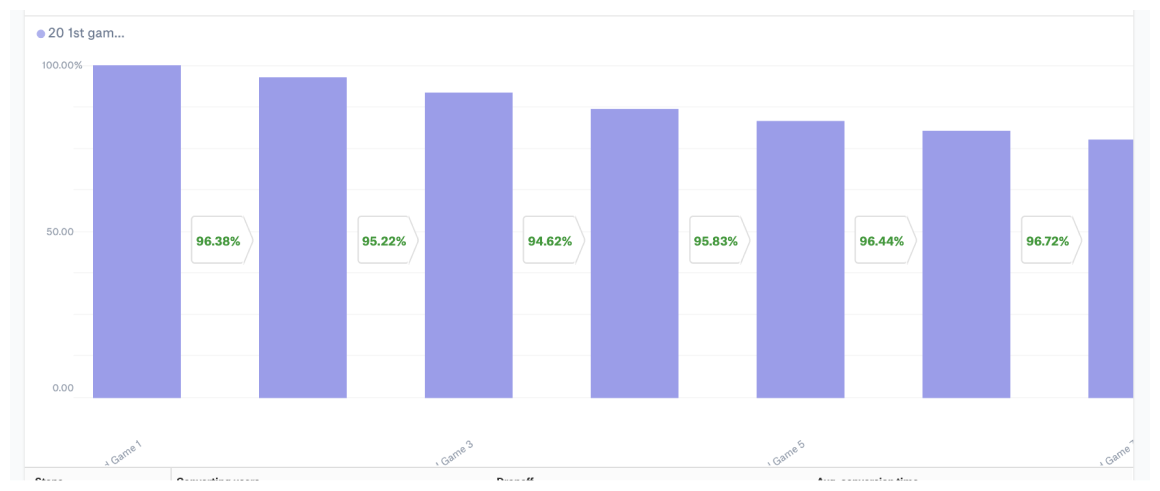
- The visualization gave no overview and required long horizontal scrolling, making results impossible to share in Slack or paste into a meeting deck
- Filters were hidden behind a modal
- Teams followed the integration docs into inconsistent event naming conventions
The Excel studio
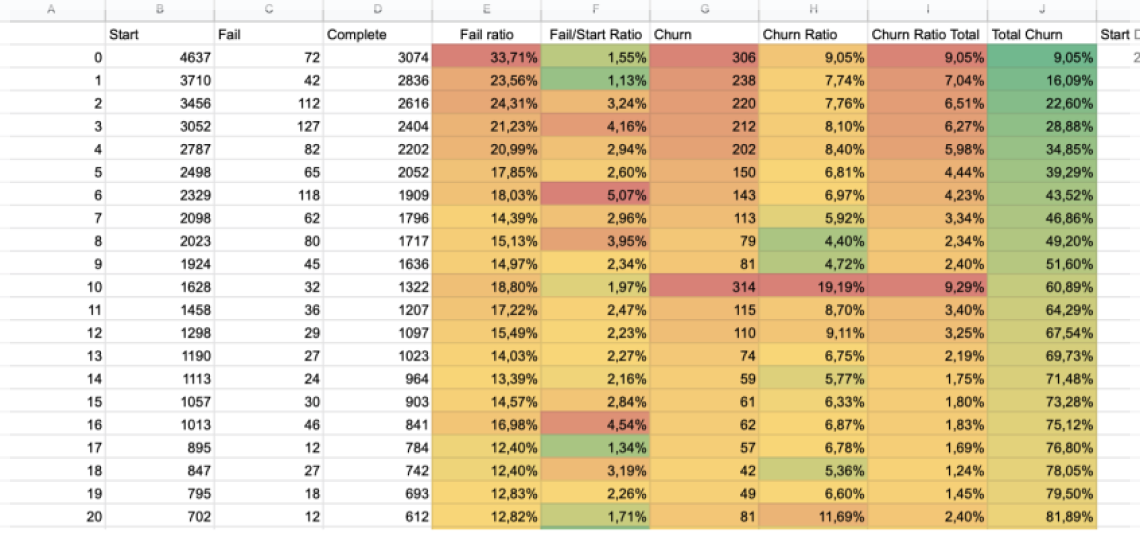
I got the studio's permission to share their homegrown report with other users, and the response was positive. The users had already designed the visualization they wanted, so I took it as the starting point.
Market research
Competitor funnel features were generic conversion funnels, built for e-commerce flows of four or five steps. Their horizontal column charts could not handle an 18-step game progression funnel. We found no funnel tool built for game progression.
The work
Users described two jobs in the interviews: measuring player progression, and tracking monetization, like which ad placements were most profitable. Monetization was tempting because it ties directly to revenue, but we cut it from version one.
Progression was the dominant topic in every design partner conversation, and 84 percent of events in the production data confirmed it. Partners were satisfied with their existing monetization tracking, while progression was where they were building Excel workarounds. I chose to focus on progression for the first prototype and live data user tests because it was where the existing feature failed most clearly across those two dominant use cases.
A heatmap adapted from the studio's Excel report
It is dense, easy to scan, and easy to screenshot. It splits by the dimensions the data said mattered, build and country, with lazy loading so dimension splits would not explode server cost.
I built it as a vertical funnel to accommodate the number of steps game funnels needed.
Progression-only mode
Since 84 percent of funnel events were progression events, we added a dedicated mode with per-level detail that a generic funnel cannot show.
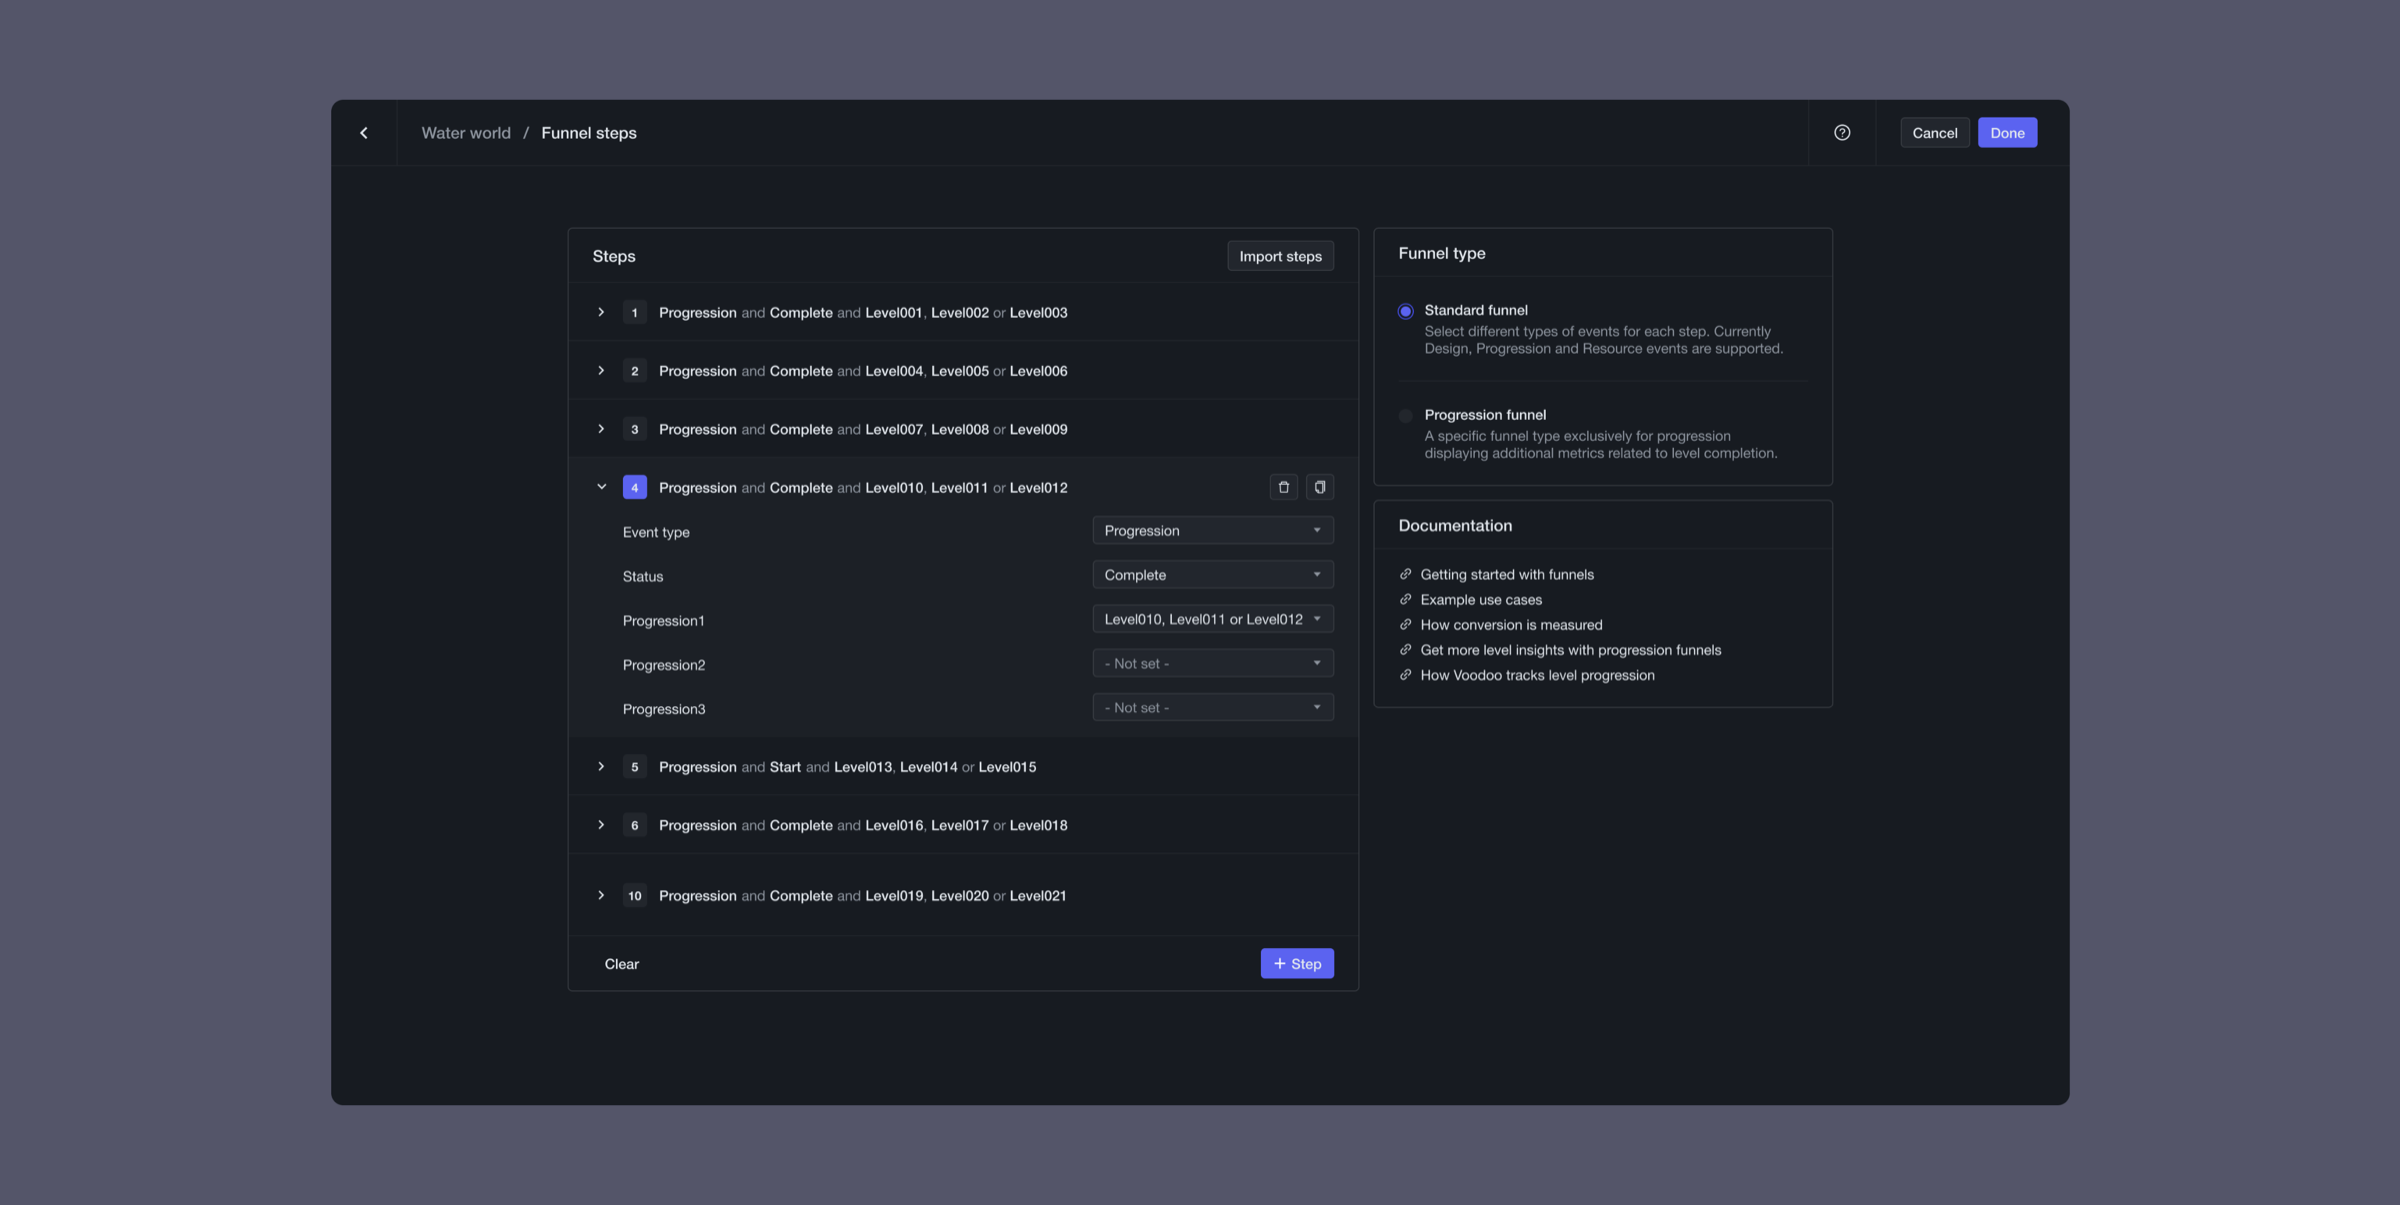
A creation form that mirrors the SDK
Each step reads as a regular sentence, in the exact structure of the event the SDK fires. This closed the gap between what developers wrote in code and what they built in the UI, and made logical operators visible.
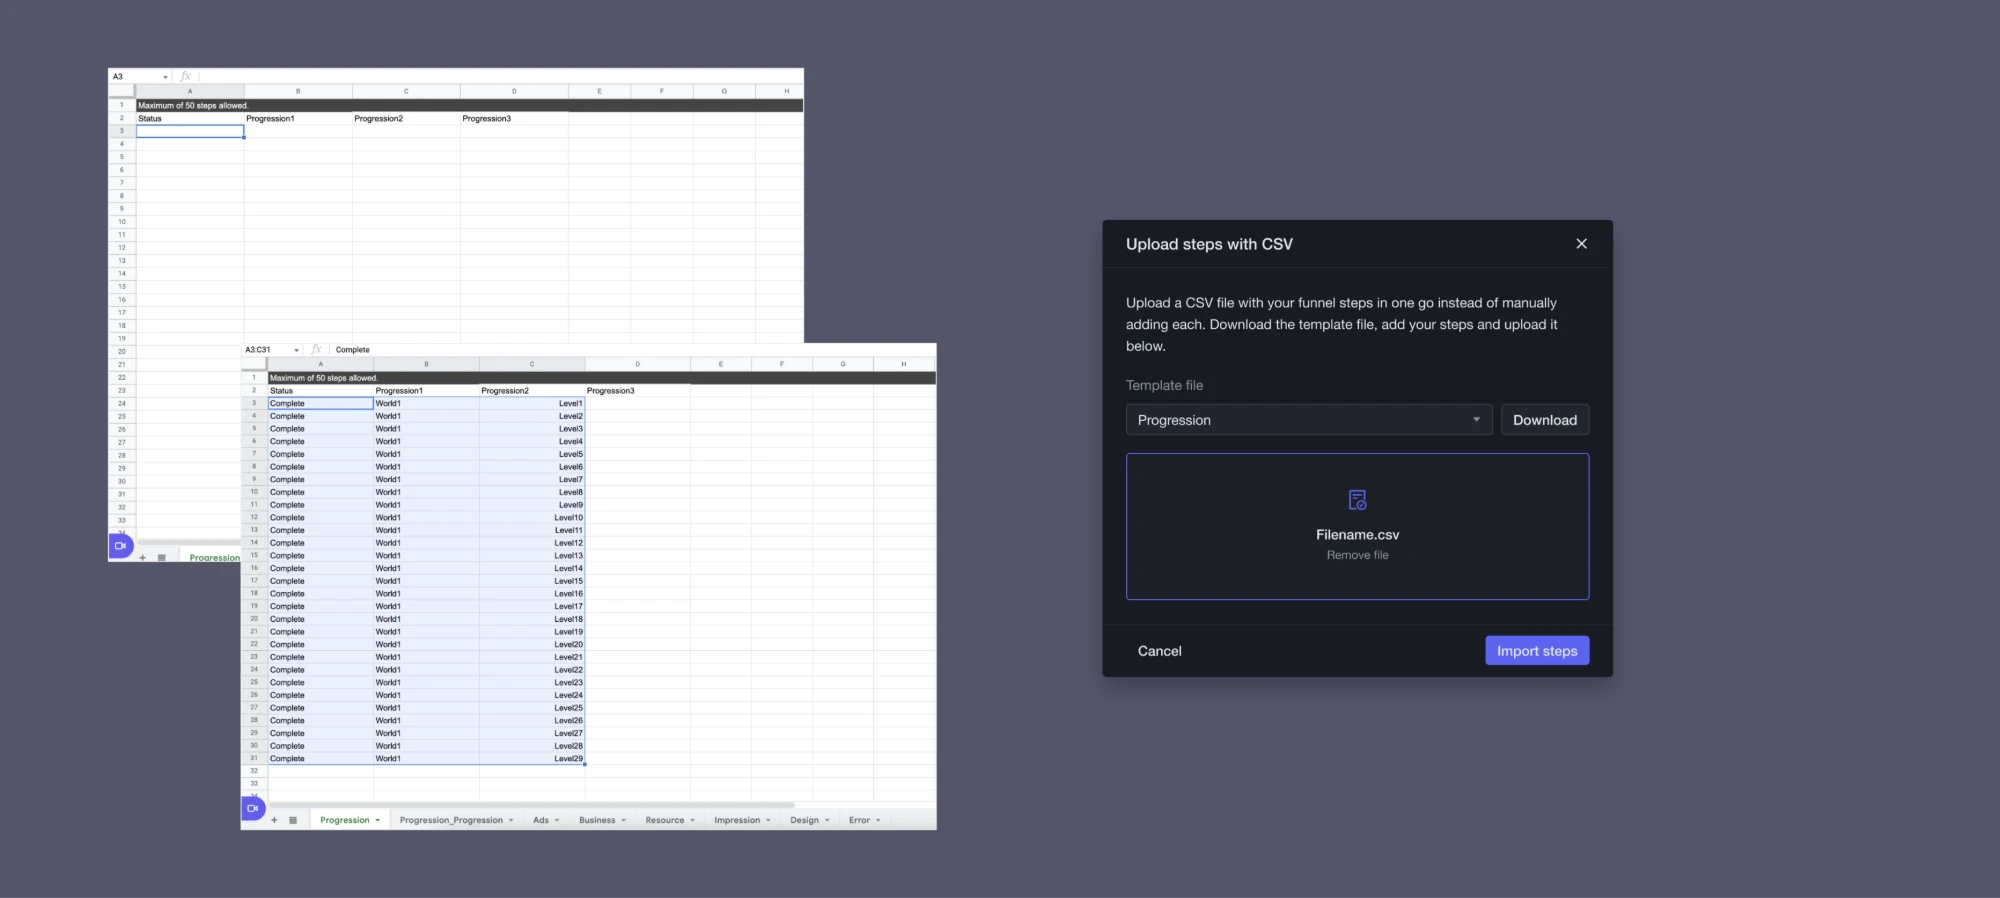
CSV import for bulk creation
Studios ran three or more iterations per game across many games, and they planned all of it in spreadsheets. I made it possible to create funnels in bulk from a CSV.
A visible filter flow
We moved filters out of the modal into the open, as a pattern that could later roll out across the platform.
What we cut
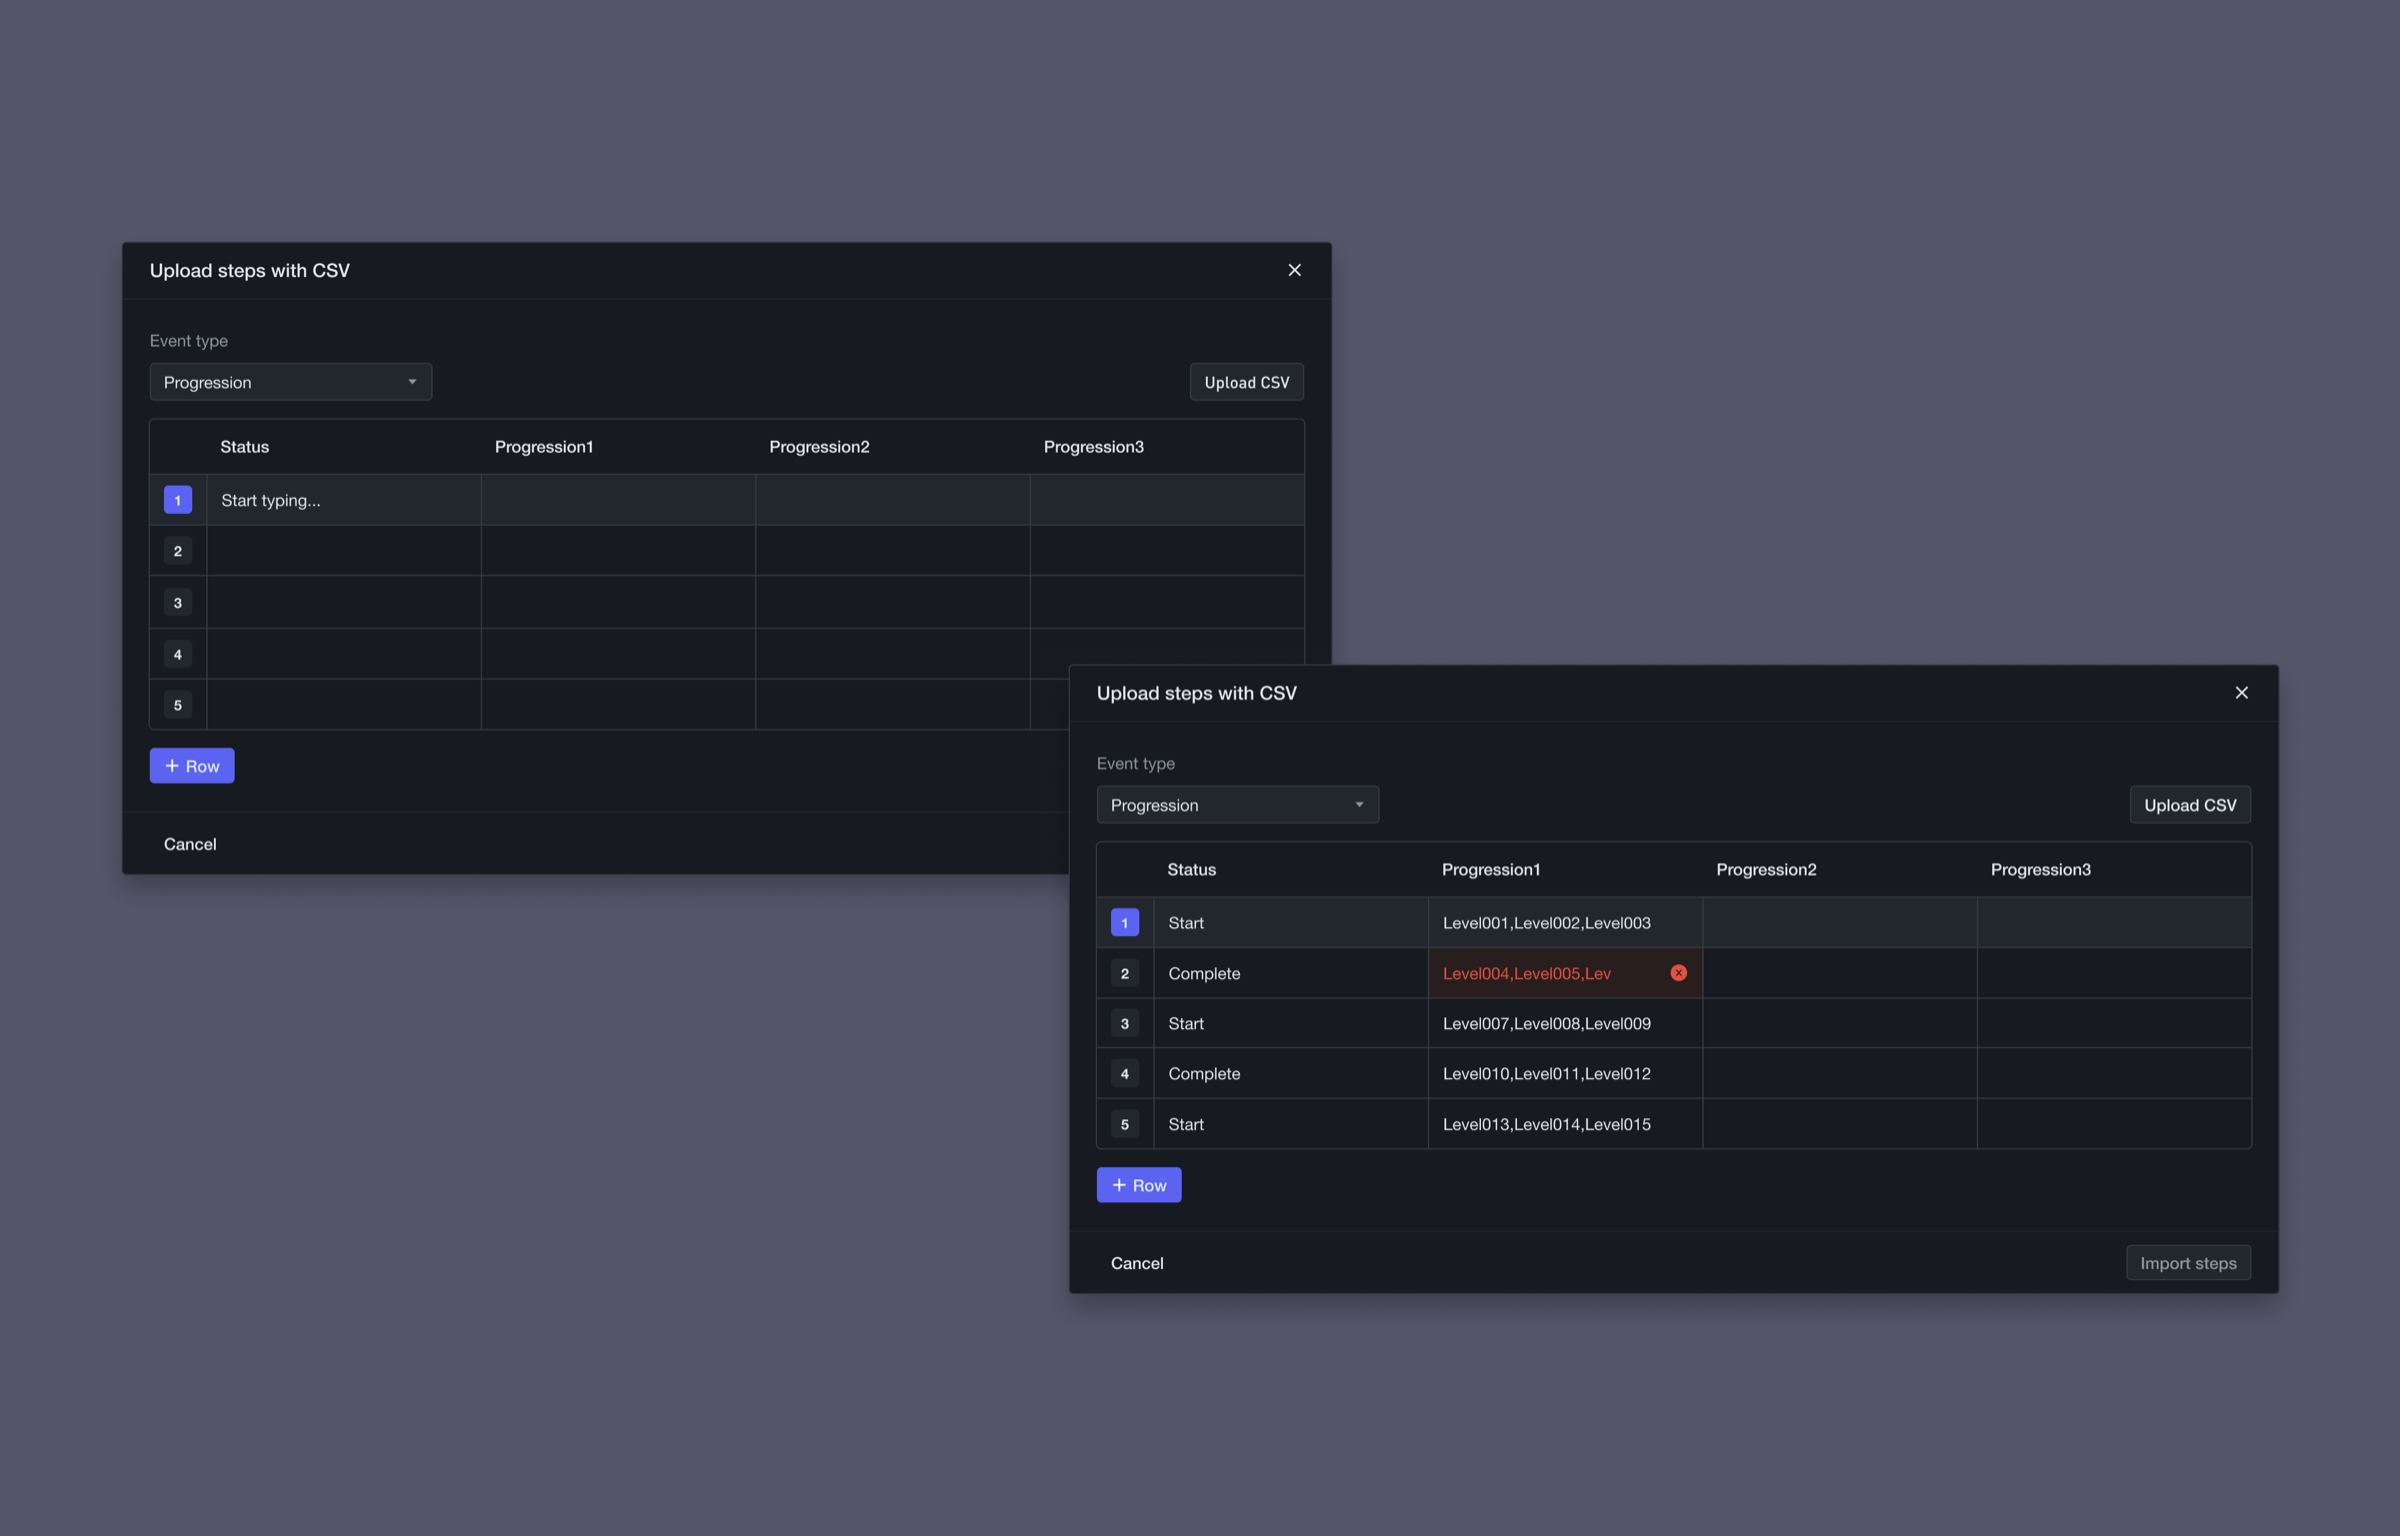
We descoped a spreadsheet-mimicking inline editor to hit the beta. Users already had a planning tool they trusted, and rebuilding Excel inside our product was expensive front-end work that replaced something that already worked for them. CSV import covered the same need and made the editor unnecessary for launch.
The outcome
The redesigned funnels received positive feedback from customers, several of whom were disappointed they couldn't continue using the prototype after testing.
The new visualisation gave GameAnalytics a way to present funnel data specifically for game developers, rather than following the conventions of general-purpose analytics tools.
Five years later, the feature still works much as we designed it and remains prominently marketed on the GameAnalytics website.
The design system I built alongside the feature, which extended across the rest of the platform, is also still in use and continues to evolve.